How to measure product launch success (without guessing)
A successful launch is not defined by traffic volume. It is defined by whether the right people found your product, signed up, and started using it.
You launched. The post went live on Product Hunt at 12:01 AM. You shared it on X, posted in two Slack communities, and sent it to your newsletter list.
By noon, you have 2,000 visitors. Your Slack is blowing up with congratulations. Strangers are commenting on the Product Hunt page. Your traffic chart looks like a mountain.
It feels like a success.
But is it?
Most founders have no idea. They look at the traffic spike, feel good, and move on. Two weeks later, they check their user list and find that 90% of those visitors never signed up. And of the ones who did, most never came back.
The problem is not the launch. The problem is that nobody defined what success looks like before the launch happened.
Why launches are misleading
Launches produce a specific type of data that is extremely easy to misread.
The numbers are big. The movement is fast. The emotions are high. You see thousands of visitors, hundreds of comments, and dozens of messages, and your brain interprets all of that as success.
But volume is not success. Volume is attention. And attention only matters if it converts into something durable.
The most common post-launch mistake is optimizing for the spike instead of the outcome. You measure how many people saw it when you should be measuring how many people stayed.
Set your definition of success before you launch
The single biggest fix for post-launch confusion is deciding, in writing, what a win looks like before you go live.
Do it the day before. Pick one primary goal, not five: signups, waitlist emails, revenue, or qualified feedback. Then name the number that would genuinely satisfy you, and be specific. "A good launch is 75 signups with at least 40% activation" is a definition you can measure against. "A good launch is a lot of buzz" is not.
Add one guardrail metric alongside the headline number, and make it a quality measure like activation. Signups on their own are easy to inflate with the wrong audience, so pairing them with activation keeps you honest about whether those signups were real. If you hit your signup target but activation collapses, you did not have the launch you think you did.
Write these two numbers on a sticky note and put it next to your screen for launch day. Now every spike and every quiet hour gets measured against a plan you made with a clear head, instead of judged by how the day happened to feel. This one habit turns a launch from an emotional event into an experiment with a result you can actually read.
Vanity metrics vs real launch metrics
Here is the difference.
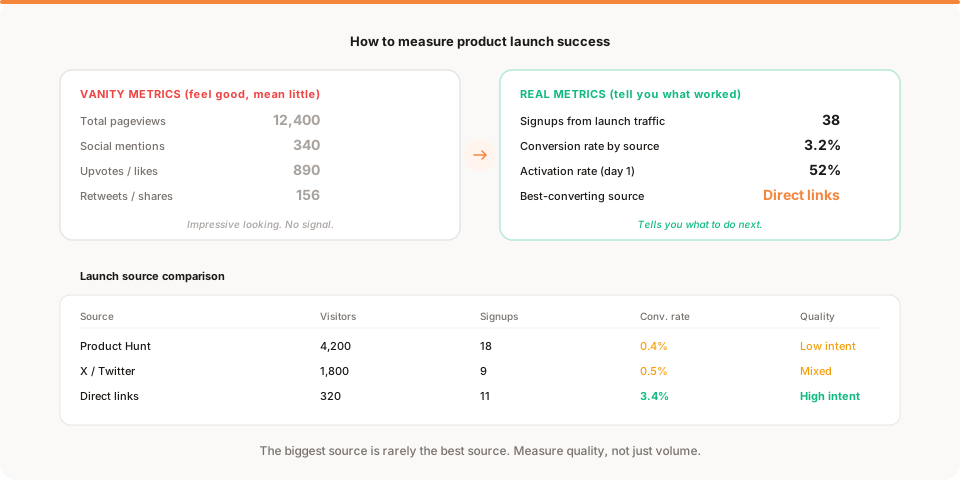
Vanity metrics feel good on launch day but tell you nothing useful:
- Total pageviews
- Number of upvotes
- Social media mentions
- Shares and retweets
- Position on the Product Hunt leaderboard
These are social proof. They are not product signals.
Real launch metrics tell you whether the launch worked:
- Signups from launch traffic. Not total signups. Signups specifically attributed to the launch sources.
- Conversion rate by source. How many visitors from each channel actually signed up? This is how you learn which channel brought the right audience.
- Activation rate. Of the people who signed up, how many completed the first meaningful action in your product?
- Day-7 return rate. Did anyone come back? Even a rough check tells you whether the launch attracted users or tourists.
- Best-converting source. Which channel sent the highest-quality traffic? This is where your next effort should go.
The vanity metrics are fun to screenshot. The real metrics tell you what to do next.
What to measure by launch channel
Not all launch traffic is equal. Each channel brings a different audience with different intent levels. You need to measure them separately.
Product Hunt
Product Hunt is the default launch platform for most indie products. It drives a lot of traffic, but the conversion rate is typically low.
What to expect:
- High traffic volume (thousands of visitors in 24 hours)
- Low conversion rate (often 0.3% to 1.5%)
- Visitors are tech-curious but may not be in your target market
- Upvotes and comments do not correlate with signups
How to measure it:
Track unique visitors from Product Hunt separately. Measure signups from that traffic. Calculate the conversion rate. If it is below 0.5%, the audience was browsing, not buying. That is normal for Product Hunt and does not mean your product is broken.
X / Twitter
Twitter launches are fast and uncontrollable. A thread can get 10 likes or 10,000 depending on timing, tone, and luck.
What to expect:
- Spike lasts 24 to 48 hours, then drops sharply
- Conversion rate varies wildly (0.2% to 3%) depending on your audience fit
- Replies and retweets do not predict signups
- Followers gained during launch may or may not convert later
For a deeper comparison of how different channels stack up, see which traffic source converts best.
How to measure it:
Tag your launch tweet link with UTM parameters or track the referral source directly. Compare conversion rate from Twitter traffic vs your baseline. If Twitter converts at 0.3% but your organic search converts at 4%, Twitter was awareness, not acquisition.
Reddit and communities
Reddit, Hacker News, Indie Hackers, and niche Slack groups can drive high-quality traffic if the community matches your product.
What to expect:
- Traffic quality depends entirely on how well the community matches your audience
- Reddit traffic is unpredictable and often one-time
- Comments can be brutally honest, which is useful but not a metric
- Hacker News can send enormous spikes with very low conversion
How to measure it:
Same approach. Separate the traffic by source. Compare conversion rates. A small subreddit that sends 50 visitors with a 6% conversion rate is more valuable than a front-page Hacker News post that sends 5,000 visitors with 0.1%.
Newsletter and email
If you have an existing audience, email is usually the highest-converting launch channel.
What to expect:
- Lower volume (depends on list size)
- Higher conversion rate (often 5% to 15%)
- These are people who already know you and opted in
- Activation rate is also typically higher
How to measure it:
Track clicks from the email. Measure signups. Compare activation rate to other channels. Email is often the best channel for early traction even if the numbers look small compared to a Product Hunt spike.
The launch evaluation framework
After the first 72 hours, sit down and answer these five questions:
1. How many signups came from launch traffic? Not total signups. Signups attributed to the launch channels specifically.
2. Which source converted best? Break down conversion rate by channel. This tells you where your audience actually is.
3. What is the activation rate for launch signups? If 100 people signed up and 10 completed onboarding, your launch attracted mostly tourists. If 100 signed up and 60 activated, you found real users.
4. Did any source surprise you? Sometimes the smallest source converts the best. A niche Slack group or a single blog mention might outperform a 5,000-visitor Product Hunt spike. Look at quality, not volume.
5. What would you do differently next time? Based on the data, which channel deserves more investment? Which one performed worse than expected? What would you change about your landing page, your positioning, or your targeting?
Rough benchmarks so you can judge the numbers
Benchmarks are dangerous if you treat them as targets, because they vary enormously by product, price, and audience. But rough ranges help you tell "normal" from "something is wrong," so here are honest ballparks.
For signup rate from launch traffic, Product Hunt commonly lands between 0.3% and 1.5%, Twitter swings from 0.2% to 3% depending on audience fit, a well-matched niche community can beat both, and an existing newsletter often converts at 5% to 15% because those people already know you. If a channel comes in far below its range, the audience probably did not match, which is information, not failure.
For activation, the useful comparison is your own baseline rather than any public number. If your normal signups activate at 50% and your launch cohort activates at 15%, you attracted tourists. If launch signups activate near or above your baseline, you found real users, even if the raw count was small.
For day-7 return, treat anything in the 20% to 30% range from a launch cohort as a reasonable early signal, and remember that a small cohort makes this number noisy. The point of all of these is not to hit a magic figure. It is to compare against your own history and against the goal you set before you launched.
What to do in the week after launch
The launch itself is day one. The real work starts on day two.
Day 1 to 2: Capture the data
Make sure you have clean tracking in place. If you did not set up source attribution before launch, you may not be able to separate Product Hunt traffic from Twitter traffic from direct visits. Set up tracking before your next launch. This is one of the first things to get right.
Day 3 to 4: Analyze by source
Once traffic normalizes, break down your numbers by channel. Calculate conversion rates. Identify which source brought users who actually signed up and activated. Ignore the channels that brought volume but no conversions.
Day 5 to 7: Make one decision
Based on what you learned, make one decision:
- If a specific channel converted well, plan to invest more effort there.
- If your landing page had high bounce from launch traffic, consider creating a dedicated landing page for that audience next time.
- If activation was low across all channels, the problem is in your onboarding, not in the launch.
Do not make five decisions. Make one. The launch gave you data. Use it to take one clear step forward.
The most common launch measurement mistake
Measuring launch success by how it felt instead of what it produced.
A launch that feels amazing because of traffic and social buzz but produces 12 signups and 3 activated users is not a success. It is a marketing event.
A launch that feels quiet because it only drove 200 visitors but produced 15 signups with 70% activation is a much stronger signal. Those are real users who wanted your product.
Feelings are not metrics. Metrics that matter are the ones that tell you whether people found your product, wanted it, and started using it.
Launches are data, not destiny
A single launch does not define your product. It is one data point.
If the launch went well, great. Double down on what worked. If it did not, you now know which channels do not convert and which parts of your experience need work.
The best founders treat launches as experiments, not events. They measure, learn, and launch again. Each iteration gets sharper because the data gets better. For a guide to what to do once the spike fades and you have steady-state data to work with, what to do after you launch covers the post-launch analysis process in full.
And if your current analytics tool makes it hard to separate launch traffic by source, calculate conversion rates, or track activation, that is a sign the tool was not built for this. You need answers, not dashboards.
Write the launch down before you forget it
One last habit, and it costs five minutes. Within a day or two of the launch settling, write a short note to yourself: what you expected, what actually happened by channel, the one thing that surprised you, and the single change you will make next time. Launches blur together fast, and the specific lessons, which community over-delivered and which headline fell flat, evaporate within a week if you do not capture them. That note becomes the starting point for your next launch, so each one compounds on the last instead of starting from scratch.
Keep reading
- What to track in your first week after launch: a day-by-day guide to what matters
- Traffic is up but conversions are down: how to diagnose the most common launch traffic pattern
- The 5 metrics that actually matter: what to focus on after the spike fades
- Muro for builders: real-time launch tracking with plain-language insights