I deleted my analytics dashboard and shipped more
Checking your analytics dashboard every day feels like work but rarely changes what you build. Most founders need a short summary they can read in two minutes, not a dashboard they open out of anxiety.
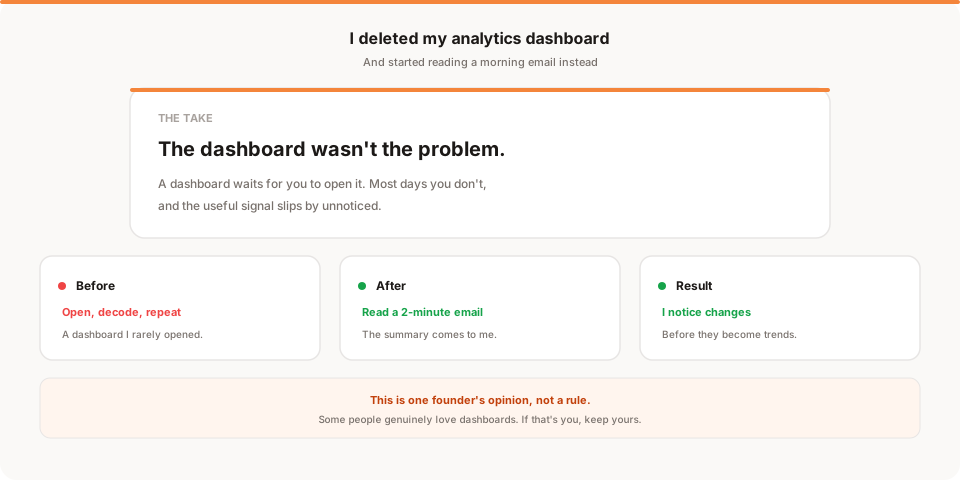
For about two years, the first thing I did every morning was open my analytics dashboard.
Coffee in one hand, the other hand clicking the bookmark. Pageviews. Sources. Yesterday vs the day before. I'd scan the charts, nod at nothing in particular, and close the tab.
Then I'd do it again at lunch. And once more before bed.
Here is the embarrassing part. In two years of doing this, I cannot point to a single morning where opening that dashboard changed what I built that day. Not one.
I was treating "checking analytics" like work. It felt responsible. It felt like the thing a serious founder does. But it was closer to checking the fridge for the fourth time hoping new food appeared.
So a few months ago, I deleted the bookmark. And then I deleted the dashboard habit entirely.
I shipped more in the next month than I had in the previous three.
The dashboard was anxiety with a UI
Let me be honest about what those daily check-ins actually were.
They were not analysis. Analysis is when you have a question, you look at data to answer it, and the answer changes a decision. I almost never had a question. I just had a vague unease about whether things were "working," and the dashboard was where I went to soothe it.
The numbers never soothed anything, of course. If traffic was down, I felt bad. If traffic was up, I wondered if it would last. Either way I closed the tab slightly more wound up than I opened it, and then I tried to write code with that hum in the background.
A dashboard you open out of anxiety is not a tool. It is a worry loop with charts.
Daily numbers are mostly noise
Here is the other problem, and it is a math problem, not a feelings problem.
When you run a small product, your daily numbers are tiny. Forty visitors one day, seventy the next. That is not a 75% increase in anything meaningful. That is noise. A single Reddit comment, one newsletter mention, one slow Tuesday, and the chart swings wildly.
Staring at noise every day does something subtle and bad: it tricks you into reacting. You see signups dip for two days and you start second-guessing the onboarding you shipped last week. You see a spike and you drop your roadmap to chase whatever caused it. Neither reaction is based on a real signal, because two days of data from a small product is not a real signal.
The founders I know who actually grow things are not the ones watching the dashboard most closely. They are the ones talking to users, shipping, and checking the numbers just often enough to catch something big.
What I actually needed
When I stripped it back, I realized I only ever needed the dashboard to answer three questions, and never urgently:
- Did anything big move? (A real jump or drop, not daily wobble.)
- Where are signups coming from? (So I know what is working.)
- Is the overall trend up, flat, or down? (Zoomed out, not day to day.)
That is it. Three questions, answerable in about two minutes, maybe once a day. I did not need a dashboard with twenty tabs for that. I needed someone to glance at the numbers and tell me, in a sentence or two, whether anything deserved my attention today.
Since I did not have an analyst, I built the thing that does that for me. Every morning at 8 AM I get a short email: visitors, signups, where they came from, and how the numbers moved. I read it before my coffee is cold. If nothing moved, I close it and get back to building. If something did, I go look properly.
I have not opened a traditional analytics dashboard in months. I do not miss it. (Yes, this is the part where I admit I built Muro to do exactly this. It started as a script for myself before it was a product.)
"But what if I miss something?"
This is the objection everyone raises, and I had it too. Deleting the dashboard felt reckless. What if conversions tanked and I did not notice for a week?
Two things.
First, the daily check-in was never actually catching that. I was looking at the numbers constantly and still spotting real problems late, because they were buried in the noise of normal daily swings. Looking more often did not mean noticing sooner. It mostly meant worrying more.
Second, a real movement is big enough that it does not need you hovering. A 20% drop in signups shows up clearly in a two-minute summary. You do not need to be staring at a live dashboard to catch the things that matter. You need the things that matter to be surfaced clearly when they happen.
Constant watching is not the same as good monitoring. Often it is the opposite.
What changed when I stopped
The honest results, a few months in:
- I started my mornings building instead of scanning. That first hour, the good one, used to go to the dashboard. Now it goes to actual work.
- I stopped making twitchy decisions. No more second-guessing last week's work because of two slow days.
- I felt better. Less ambient dread about numbers I could not control anyway.
- I did not miss anything important. Every real movement still reached me. It just reached me in a sentence instead of a chart I had to decode.
I am not telling you analytics do not matter. They do. I am telling you that opening a dashboard every day and understanding your business are not the same activity, and most of us confused the two for years.
When a dashboard actually earns its place
I want to be fair to dashboards, because deleting mine was right for me, not a universal law. There are real moments when you should open the full data and sit with it.
The first is a launch. When you post to Product Hunt or Hacker News or ship a big feature, the hours afterward are genuinely dynamic, and a live view helps you see which channel is landing while you can still act on it. That is a specific window with a specific question, not a daily habit.
The second is when a summary flags something. If the morning email says signups fell 30%, that is your cue to go digging: which page, which source, which step. The summary is the smoke alarm. The dashboard is where you go once it goes off, not somewhere you camp out waiting for smoke.
The third is a real question you can only answer by slicing the data. "Do mobile visitors from Twitter convert worse than desktop visitors from search?" is a fair question, and you need the full detail to answer it. But notice the shape: you have the question first, then you open the data. That is the exact opposite of opening the dashboard and hoping a question appears.
The pattern across all three is that the data serves a decision you already care about. That is analysis. Everything else, the idle refreshing and the coffee-in-hand scanning, is the habit I killed. If your dashboard visits usually start with a question, keep them. If they usually start with anxiety, you already know.
How to run your own two-minute check
If you want to try this, here is the setup that replaced my dashboard habit, tool aside.
Start by writing down the three questions that actually matter for your product right now. For most early products they are some version of: did anything big move, where are signups coming from, and is the trend up or down. Write yours on a sticky note. If a metric does not help you answer one of those, it does not belong in your daily view.
Next, decide your cadence honestly. A two-minute glance once a day is plenty for most people, and once a week is fine in the earliest days when the numbers are tiny and noisy. The goal is to look often enough to catch a real move and rarely enough that you are not reacting to wobble.
Then flip the direction. Instead of pulling the numbers by opening a dashboard, get them pushed to you: a daily or weekly summary of those few metrics. Pushed numbers get read; pulled numbers get either obsessed over or ignored, with very little healthy middle.
Finally, add the one-sentence habit. Before you look, predict what happened yesterday and whether it changes today's plan. Most days your prediction will be right and the answer will be no. That is not wasted effort; it is the confirmation that lets you close the tab and get back to building.
The hour I got back
The real prize was not calmer mornings, though I will take those. It was the hour.
That first hour of the day, when my head was clearest, used to go to scanning charts. Now it goes to the two things that actually move a small product: talking to users and shipping. In the months since I stopped, I have had more real conversations with customers than in the year before, simply because the time existed and the dashboard was no longer there to absorb it.
I also gave myself one rule to replace the daily ritual: one deeper look each week. Once a week I open the full data with an actual question in mind, spend twenty focused minutes, and write down what I learned and what I will change because of it. That single weekly session has taught me more than hundreds of anxious daily glances ever did, because it starts with a question and ends with a decision.
None of this required a new tool. It required admitting that the daily check-in was a comfort ritual dressed up as diligence, and then giving that time back to work that compounds.
The one thing I still glance at
I want to be honest that I did not go fully blind. I kept one number in my daily line of sight: new signups. Not a dashboard, just that single figure in my morning email, because for my product it is the closest thing to a heartbeat. If it moved a lot in either direction, that was my cue to actually go and look. Everything else, traffic, sources, top pages, I let the weekly review handle.
The lesson was not "ignore your data." It was "pick the one number that would actually change your day, keep that one visible, and stop staring at the other twenty." For you that number might be trial starts, or revenue, or active users. The discipline is choosing it deliberately instead of watching all of them out of a vague sense that you should. One heartbeat metric, glanced at, beats a full dashboard studied.
Try this for a week
You do not have to switch tools to test this. Try a simple experiment:
- Do not open your analytics dashboard for one week.
- Each morning, write down one sentence: what do you think happened yesterday, and does it change what you will build today?
- At the end of the week, check the actual numbers once.
I would bet two things. One, your guesses were roughly right, because you know your own product. Two, nothing you saw in that end-of-week check would have changed a single thing you built, even if you had seen it daily.
If that is true for you the way it was for me, you have just found a free hour every morning. Spend it building something, or talking to a user. Either one will move your product more than the dashboard ever did.
And if you want the two-minute summary without the dashboard at all, that is exactly what I built Muro to do. One short email at 8 AM, no charts to interpret. But the tool is beside the point. The habit is the point. Delete the bookmark first. See how it feels.
I think you will ship more too.